IranTop
A system monitor for the terminal that draws your charts four different ways
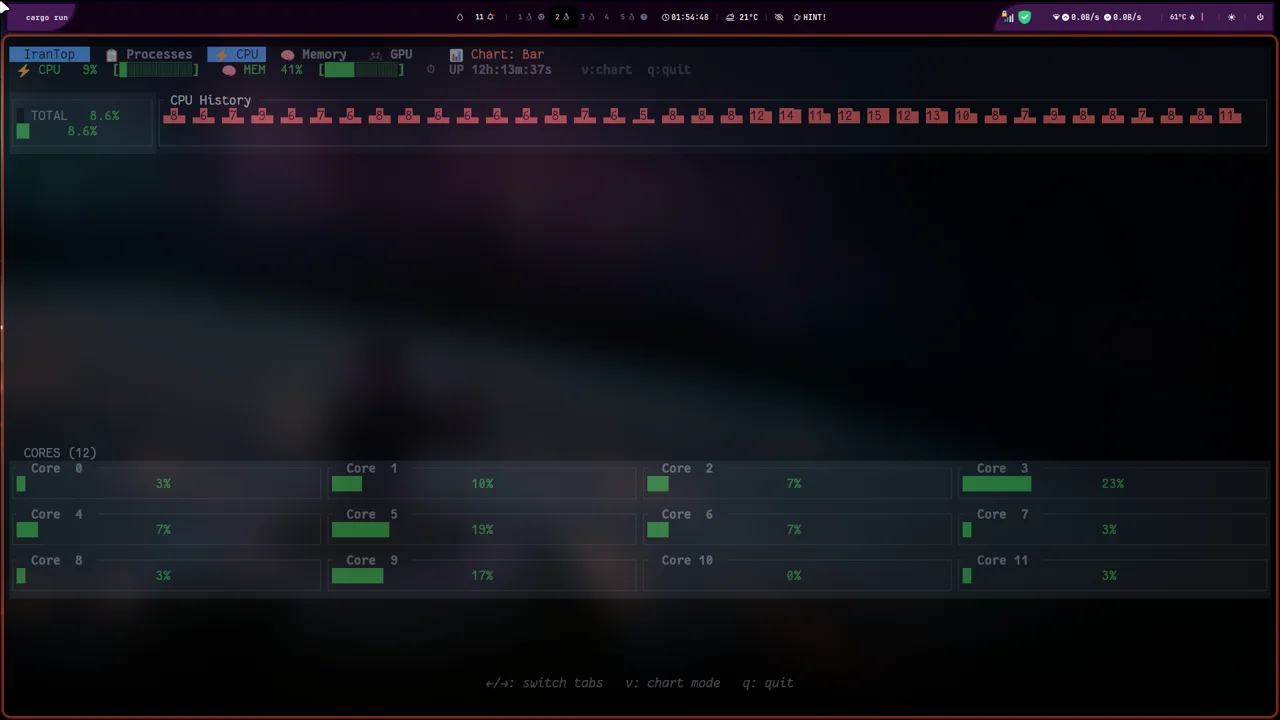
A system monitor that lives in the terminal, and lets you switch how it draws the same data.
What it is
htop for people who want the charts to be readable. Same job — watch CPU, memory, processes, GPU — with one
difference: the same series can be drawn as a line, a bar, a sparkline or a donut, and you switch between them
instantly with one key.
That sounds cosmetic. It is not, when the question is “did that spike happen every second or once every ten”, because a donut cannot answer it and a line chart can. Being able to flip the representation without leaving the keyboard is the whole idea.
What it does
- Total CPU, per-core, and history at once, on one screen, because a total of 8% tells you nothing when one core is pinned.
- A live process list you can search, sort by any column, and kill with a confirmation step.
- Four chart modes on the same data: line, bar, sparkline, donut.
- GPU monitoring through
nvidia-smi, on the machines where that matters. - Mouse support, keyboard shortcuts, and a small number of runtime dependencies.
The numbers
| 3 | runtime dependencies |
| 4 | chart modes over the same series |
| 1 key | cycles through all of them |
Why it’s worth a look
This is the smallest project on this page, and I included it because of what it demonstrates rather than its size: three dependencies, a flat directory structure, and every decision visible in one file. Nothing to configure, no build system to learn, no abstraction that only exists to be flexible. It is what a tool looks like when it is finished rather than extensible.
The kill confirmation deserves a mention. It is one line, and it exists because a keyboard-driven process killer does not have a title bar to read before you hit the key.